An infographic is a visual representation of information or data. It combines text, images, and charts to provide a clearer context for a message. And now, infographics are one of the most powerful tools for visual communication.
This guide will walk you through the steps to create infographics in PowerPoint for free, utilizing AI, and provide various types of infographics, including practical tips for creating effective ones in PowerPoint.
What is an Infographic Presentation
An Infographic Presentation is a visual-based slide deck that uses charts, icons, timelines, and illustrations to convey information quickly. And the infographic PowerPoint presentations differ significantly from traditional ones. The former tells stories with visuals while the latter relies heavily on text.
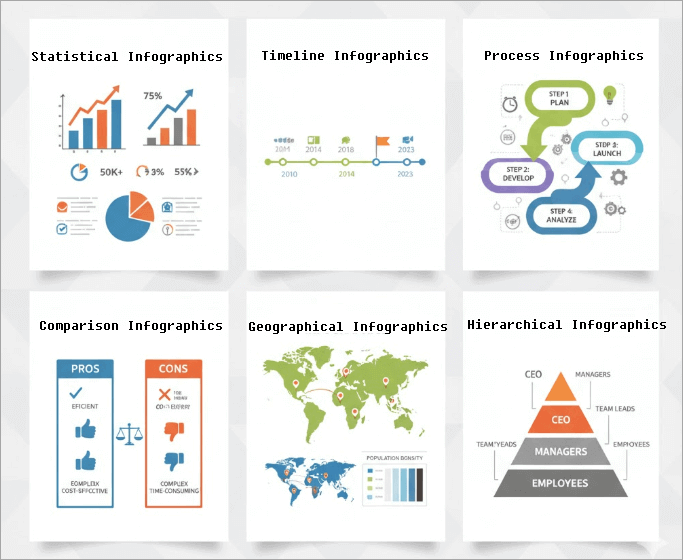
📊 Let’s check out examples of infographics you can use in presentations. They include:
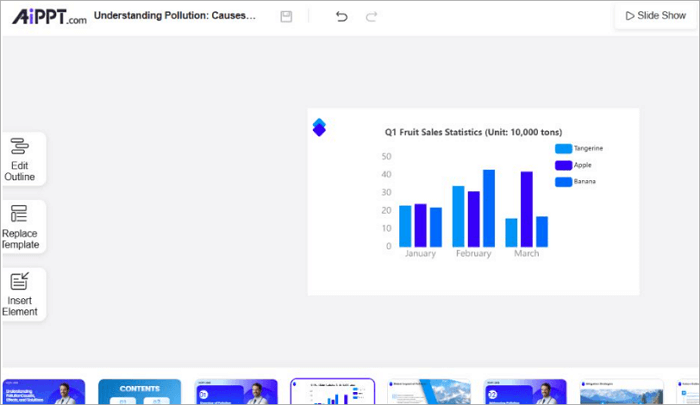
➤ Statistical Infographics: Uses charts and graphs to present data. Perfect for visualizing data, survey results, or business metrics.
➤ Timeline Infographics: A graphical representation of a sequence of events, tasks, or milestones.
➤ Process Infographics: Ideal for explaining workflows or step-by-step procedures.
➤ Comparison Infographics: Utilize tables and bubble charts to compare features, products, or strategies.
➤ Geographical Infographics: Uses maps and color codes to display data based on location or regional performance.
➤ Hierarchical Infographics: Best for showing levels of importance, organizational structures, or rank-based concepts.
How to Create Infographics in PowerPoint
Before creating infographic presentations, it is essential to understand various infographic elements, including shapes, icons, SmartArt, charts, and text boxes, to build your visual layout.
With shapes and icons, you can effectively highlight key points and visually represent data. PowerPoint also offers you many SmartArt graphics that allow you to visualize lists and processes without manual drawing.
Another infographic element you might want to use is charts. Charts help you display data using bars, lines, or slices, allowing you to spot patterns and make comparisons more easily.
🔍 Here’s a step-by-step guide on how to make infographics in PowerPoint:
Step 1: Open a blank PowerPoint presentation. If you prefer using a template, launch PowerPoint and select one to proceed.
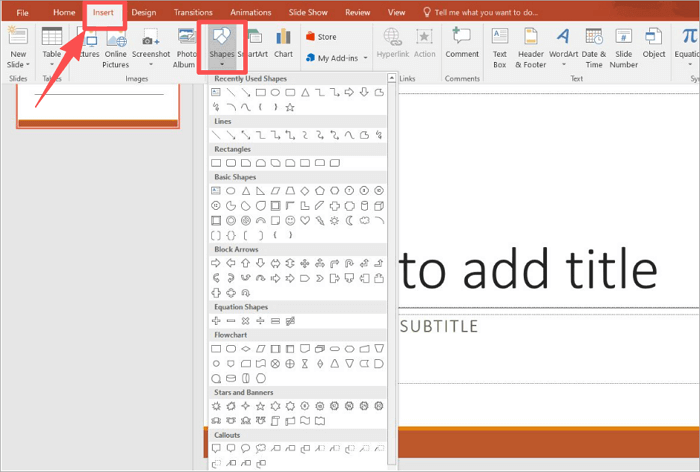
Step 2: Then, add shapes and icons to your presentation. Navigate to the “Insert” tab, select “Shapes”, and add circles, rectangles, arrows, or lines to create visual blocks.
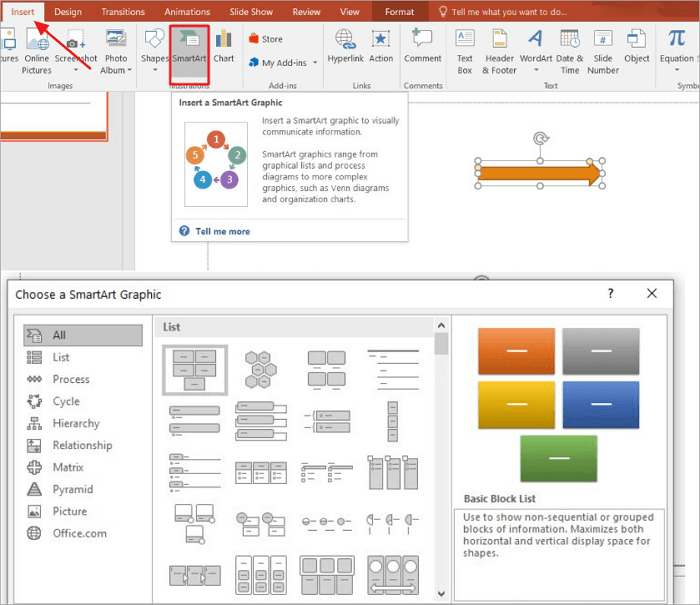
Step 3: To add SmartArt, go to “Insert > SmartArt” and explore various categories like Process, Hierarchy, or Cycle.
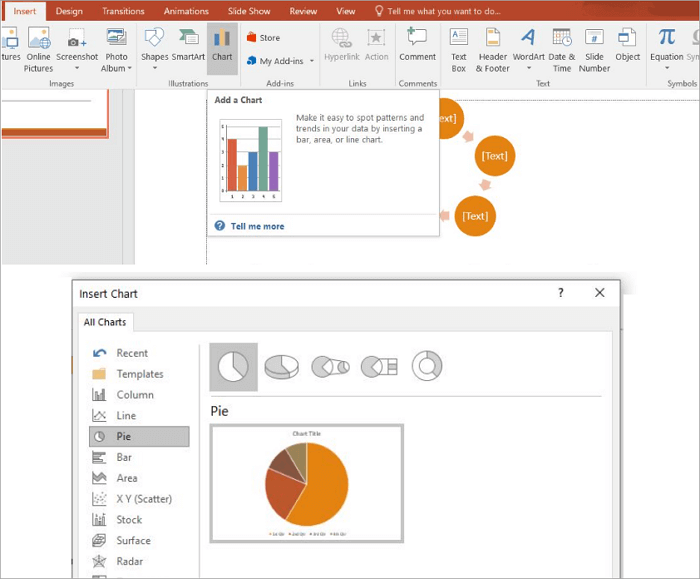
Step 4: You can also go to “Insert > Chart” to add charts and other data visuals, such as bar, pie, or line charts, in your presentation.
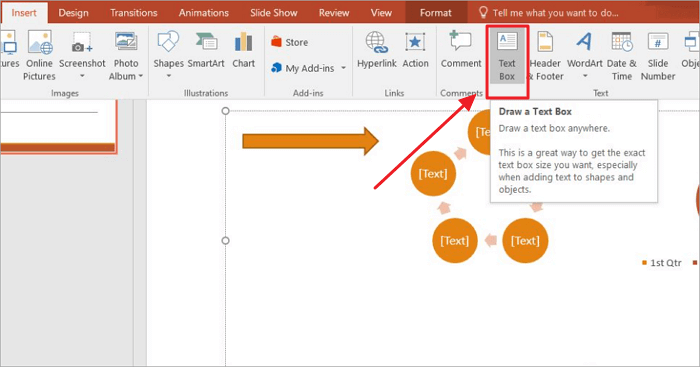
Step 5: You can also use the “Text Box” option to add new text boxes.
How To Make Infographics in PowerPoint Using AI
If you want to cut down on your slide design time and still create top-quality visuals, you’ll find AiPPT, an AI-powered tool for making creative presentations, very helpful.
With AiPPT, you can generate outlines and PowerPoint presentations from various input options, including text, topics, documents, or URLs. Enter your theme or select an option, and your presentation will be ready in seconds.
In addition to its over 200,000 ready-to-use templates, AiPPT also offers many free PowerPoint infographic templates that you can use in your presentations.
🔍 Now, let’s see how to make infographics in PowerPoint using AiPPT:
Step 1: Sign up on or log in to AiPPT.com.
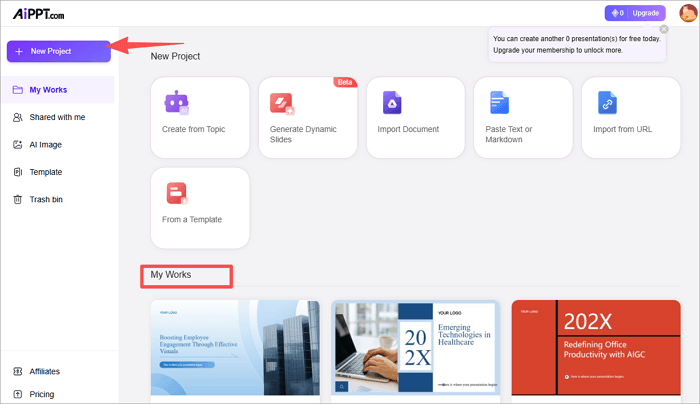
Step 2: Create a new presentation by clicking the “+New Project” button or open an existing one from “My Works”.
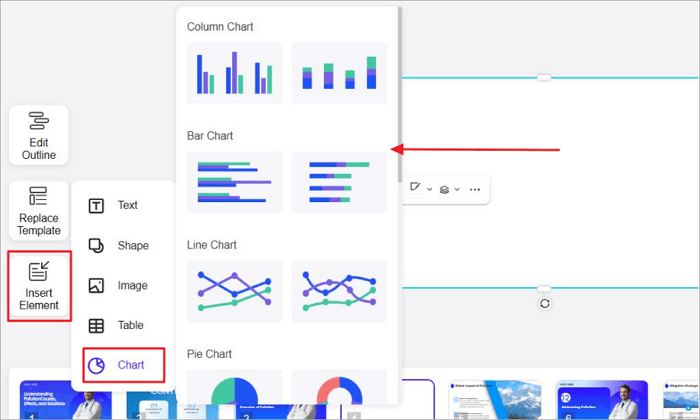
Step 3: Go to the slide you want to add an Infographic to, then click on “Insert Element”. Scroll down and select a chart type from the options available.
Step 4: And that’s it! Your infographic will be on your slide. To make further edits on PowerPoint, use the “Download” icon at the top right to export the presentation.
Related Post: >> How to Create a Pitch Deck Using AiPPT
Tips for Creating an Infographic with PowerPoint
Want to create an Infographic with PowerPoint? Here are practical tips for designing clear and effective infographics in your presentations:
- Keep Designs Simple: Don’t clutter your slide with complex designs. Remove extra elements that don’t complement your message.
- Maintain Consistency: Use the same font sizes, colors, and icon styles throughout your slides for visual harmony.
- Highlight Key Data: Use icons, charts, bold text, or SmartArt to emphasize important points in your Infographics.
- Balance Text and Visuals: Use more visuals than words in your Infographics. If possible, only use text as short phrases or labels.
Conclusion
If you want to create infographics in PowerPoint, you can use a variety of options, from shapes, icons, charts, text boxes, and SmartArt. These tools help you transform raw data into compelling visual stories for reports, class projects, etc.
However, you can speed things up a bit and generate professional and stunning slides with AiPPT. This AI-powered slide deck maker can also help you make infographic PowerPoint presentations from scratch.
Learn More About Infographic PowerPoint
Before you go, check out some common questions users ask about infographic PowerPoint presentations.
1. How to create an infographic timeline in PowerPoint?
Follow these steps to create an Infographic timeline in PowerPoint:
- Open a blank presentation or launch an existing one.
- Go to the slide you want to add the timeline to.
- Proceed to “Insert > SmartArt > Process”.
- Then select a timeline for your presentation.
- Type in the events or milestone data to visualize it.
- Adjust the colors, add icons, and align text boxes.
2. Are there free templates for infographic PowerPoint presentations?
Yes, AiPPT provides thousands of free infographic templates for PowerPoint. Plus, all of these templates are easily customizable, allowing you to tweak them to suit various needs for education, business reports, or marketing visuals.
Go on to AiPPT to find a free infographic template that fits your design theme.
3. Can I make infographics with PowerPoint?
Definitely! You can make infographics using the tools offered by PowerPoint. Combine shapes, icons, SmartArt, and charts to tell visual stories that words may not be able to.
You can start from scratch or use AiPPT to generate an entire infographic slideshow for PowerPoint instantly. Whether you’re creating infographics for a report, seminar, or lecture, AiPPT remains a good option.